OPS: What does On-base Percentage + Slugging mean?
How to equate Aaron Judge's 2024 1.159 OPS to an old-fashioned batting average like .386.
With the World Series starting today, I have a lot to say about baseball.
For those readers to whom all sports are “sportsball,” I can usually justify writing about current sports as being relevant to the election or to race or whatever.
But not in this case. This post is intended for the benefit of a niche market: older baseball fans like myself who’d like to understand better and more intuitively the newer baseball statistics terminology, such as OPS (On-base Percentage plus Slugging average). We hear batters denigrated for having a .700 OPS or praised for having a .900 OPS and we don’t know what that means.
So I’ve got a handy technique for anybody familiar with old time baseball statistics who can divide by 3 in their heads.
When I was a kid, the most prestigious statistical accomplishment for a baseball hitter was to win the batting title for highest batting average: since the 19th Century, batting average was calculated by taking the number of base hits (singles, doubles, triples, or homers) and dividing by at-bats (plate appearances minus walks, hit-by-pitches, sacrifice bunts, and sacrifice flies). So if a player came up to the plate 600 times and recorded 350 outs, 150 hits, and 100 walks (or the other miscellaneous uncounted at-bats), his batting average was 150 hits divided by 500 at-bats for a batting average of .300, which was considered a fine accomplishment.
Keep in mind that it was recognized even at the time that batting average was not the be-all and end-all of hitting. (For an extremely intelligent 1960 fan’s appreciation of baseball statistics 64 years ago, here’s John Updike’s classic New Yorker essay on Ted Williams’ final at-bat, “Hub Fans Bid ‘Kid’ Adieu.”)
For example, from 1966 to 1969, singles hitter Matty Alou (his most similar current player is Luis Arraez, who has won the last three National League batting titles) averaged between .331 and .342, impressive batting averages, especially during the pitching-dominated era of 1966-1968.
But even then, Alou never finished higher than ninth in the Most Valuable Player voting because Alou only hit 5 homers in those 4 years. It was recognized at the time that extra-base hit strong men like Willie McCovey, Orlando Cepeda, and Roberto Clemente were more valuable sluggers than the delicate Alou (5’9” and 160 pounds).
(Still, while batting average wasn’t an infallible metric at comparing between batters, it is pretty good at comparing seasons within a single batter’s career. For example, Ted Williams famously hit .406 at age 22 in 1941, the last ever .400 season. Remarkably, 16 years later at age 38, he hit .388. Yeah, advanced analytics says those were Ted’s two best seasons at bat, just like the crude metric of Batting Average says they were.)
Eventually, baseball statistics analysts like Bill James pointed out that simply adding together two other statistics — On-base Percentage and Slugging average — concocted a statistic called OPS that correlated much better between players than BA with winning baseball games.
On-base Percentage is much like Batting Average except that walks count as much as hits, while Slugging Average weights extra-base hits (e.g., a home run counts for four bases) more than singles (which counts for one base).
Add them together and you get a really good statistic: OPS (or On-base Percentage plus Slugging). One reason is that unlike On-Base Percentage, it treats a homer as better than a single and a single as better than a walk. Unlike Slugging Average it treats a single as better than 25% of a homer because a single hitter, like a homer hitter, did not make an out. Not making an out is an important accomplishment.
OPS isn’t the best statistic: for example, OPS+ adjusts OPS for the average level of competition and for your home field. For instance, if you play half your games in Denver at one mile of altitude, you should hit better than if you played in the depressing Oakland Coliseum. Similarly, if you are Pete Rose, hitting .335 at age 27 in 1968, the Year of the Pitcher (when Bob Gibson’s ERA was 1.12), that’s much better than hitting .325 at age 40 in 1981, a fairly normal year.
And then there’s Wins Above Replacement (WAR) which attempts to account for defense and base-running as well.
Still, OPS can be easily calculated on the fly, so it’s often used.
But what does it mean?
Here’s my suggestion for old-timers who can divide by 3 in their heads who are familiar with what is a good batting average: just divide OPS by 3 to get a roughly equivalent Batting Average figure:
OPS BA
.600 .200
.700 .233
.800 .267
.900 .300
1.000 .333
1.100 .367
1.200 .400
Hence, in 2024:
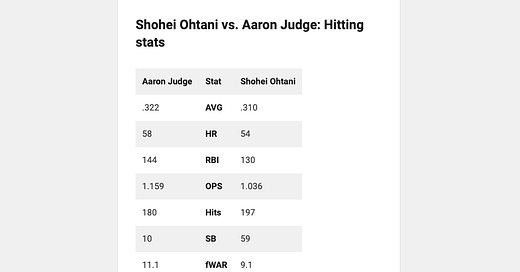
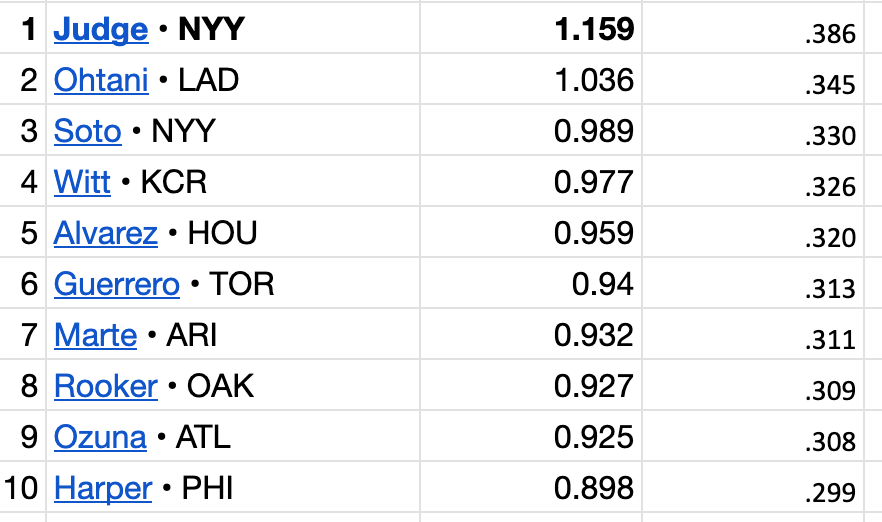
Thus, it’s easy to see that when you factor into Aaron Judge’s .322 batting average his 58 homers and 133 walks, his OPS/3 is an almost off the charts .386.
The highest batting averages since Ted’s .406 before the War have been Tony Gwynn’s .394 in the strike-shortened 1994, George Brett’s .390 in 1980 when he played in only 117 games due to injuries, Ted Williams’ .388 in 1957, and Rod Carew’s .388 in 1977. So Judge’s equivalent of .386 is really good.
Shohei Ohtani didn’t hit for as high of a batting average (.310), quite as many home runs (54), or as many walks (81), but add in his 38 doubles and 7 triples and he had a colossal number of total bases (411): so his OPS/3 was an outstanding .345.
Juan Soto of the Yankees, the new Ted Williams, was third in the MLB in OPS/3 at .330, followed by superstar young Kansas City shortstop Bobby Witt Jr. at .326.
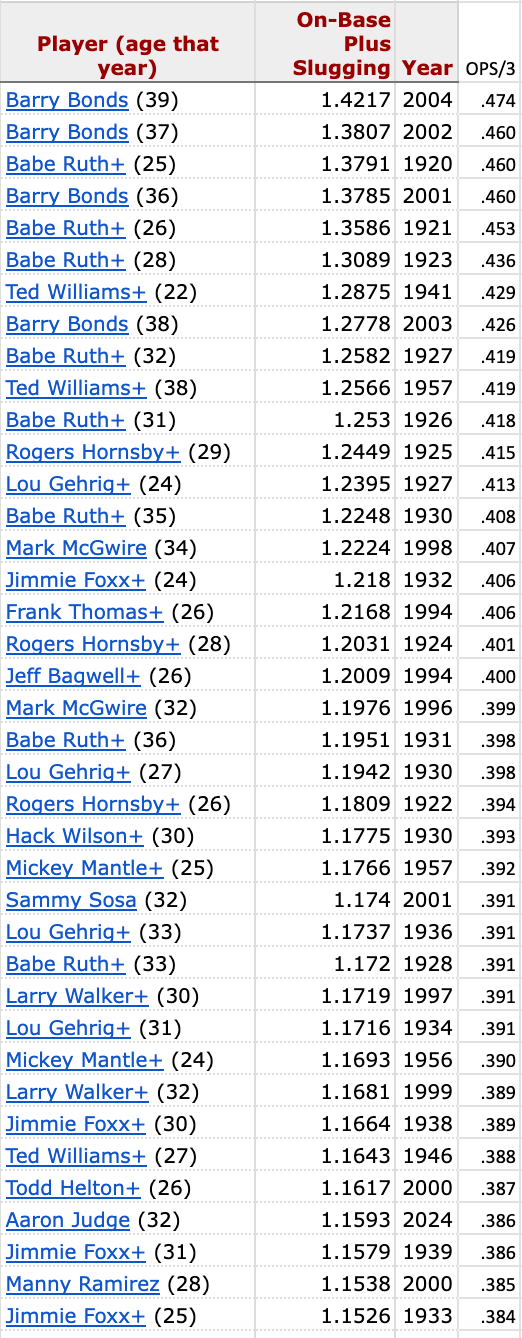
What about all-time single season for OPS/3?
Judge’s OPS/3 of .386 ranks well behind the sluggers of the interwar era and of the PED-assisted turn-of-the-century era, but, otherwise, only Ted Williams and Mickey Mantle rank higher for a single season.
I’ve been burned often enough by hero worship not to be skeptical of Judge and Ohtani’s recent stats.
But, still, these guys are good.


The logic of OPS is that it values walks. That is a major feature of Billy Bean’s Moneyball approach. Walks represent three things: outs avoided, higher pitch counts (enabling teams getting into opponents’ bull pens sooner) and men on base (potential runs). Walks, home runs, and strikeouts constitute what sabermatricians refer to as the three pure outcomes, since fielding is not an issue (except for leaping outfielders who rob batters of home runs, inside the park homers and dropped third strikes).
Even in the 1950s and 60s when I was playing youth baseball this was recognized by coaches, who were constantly telling batters that “a walk is as good as a hit.” This was appreciated by a late developing, smaller guy like me, who in four years had one extra-base hit, a triple in a game in which I pitched a complete game shutout, a day I still remember 64 years later. The only other really vivid memory I have of playing baseball during that time is watching a grand slam go over the center field fence from the mound the next year.
Good idea. Divide by 3. A good way to understand it for anyone who came of age before OBP was known to the general public. Boomers, Gen Xers, Millenials.
Dub them The Guys Who Learned Stats from Baseball Cards and Newspapers.
Thanks, Steve.