Compared to past elections such as 2012, Donald Trump did better with the New, Weird America, while Kamala did better than Obama in 2012 in old-fashioned WASP strongholds.
On Twitter, a Cornell law student named Siddharth Khurana (@SidKhurana3607) with an interest in demographics has been posting presidential winning margins from 2012 (Romney-Obama), 2016 (Trump-Hillary), 2020 (Trump-Biden), and 2024 (Trump-Kamala).
He’s got a knack for picking out interesting districts to focus upon. Is that cherrypicking? Kind of, but it can help make some overall patterns vivid.
As I pointed out in my recent post on Jewish voting in 2024, exit polls sound promising for determining how small groups vote, but they run into sample size problems. So, a complement is to analyze geographic areas (counties, towns, Congressional districts, precincts, etc.) where the Census tells us there are particular concentrations of an ethnicity of other type of group.
For example, there are small numbers of Armenians in quite a few places across the country, but Glendale, CA, a nice suburb of Los Angeles is the only place that’s 40% Armenian. So how Glendale trends might stand in pretty well for Armenians in general.
Then again, Armenians in Glendale might vote notably different from Armenians in, say, Santa Monica, who probably tend to talk to other Armenians less than do Armenians in Glendale. Or it could be that whomever makes up the other 60% of Glendale is trending strongly in a different direction from Glendale’s Armenians.
But most of the time, precinct analysis works pretty well to give you sense of the general direction that an ethnicity is moving.
So, one thing Khurana does is look up outlier locales in terms of the highest percentage of a particular ethnic group. He also points out places with the biggest changes in electoral margins over time to encourage speculation about the demographic correlates. Third, he looks at places that are amusingly weird.
A common theme is that Trump in 2024 did much better than Romney did in 2012 in the weirder places in America, like the Maharishi Vedic City in Iowa, which was founded by the Beatles’ guru Maharishi Mahesh Yogi in 2001:
Maharishi Vedic City, Iowa (pop. 277):
2012: D+15 2016: D+3 2020: D+2 2024: R+10
The Maharishi’s followers in this Iowa town are 83% white.
White Bread America
Obviously, the more Anglo-Protestant a place, the less white bread its supermarkets sell these days, but that old pejorative still is in use.
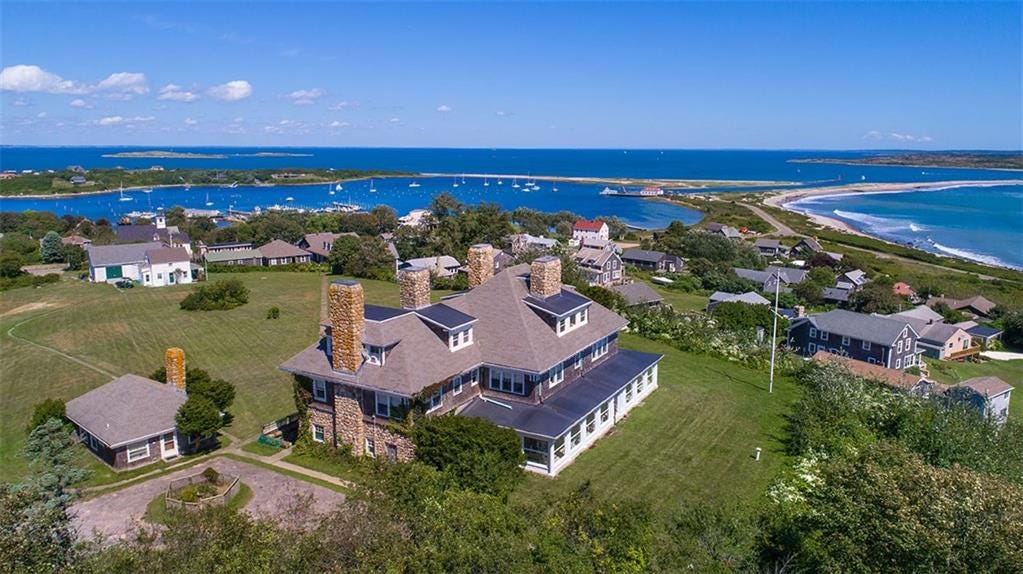
In contrast to Maharishiville, there’s Gosnold, MA, a town on islands near Martha’s Vineyard that is so WASP white bread that it’s kind of weird in 2024:
Gosnold, MA (pop. 70, 100% white, 75% college-ed):
43% English ancestry as well, which is quite high
2012: D+15 2016: D+13 2020: D+42 2024: D+54
Grand Rapids, Michigan, home of President Gerald Ford, used to be the embodiment of rock-ribbed Republican normalcy, but is now closer to a toss-up:
Here, we have the Grand Rapids-Wyoming-Kentwood metro (four MI counties, pop. 1.15M).
Was once the state's most Republican area, but has been shifting left and barely moved even as Trump flipped MI.
2012: R+15 2016: R+14 2020: R+6 2024: R+7
Tompkins County in the beautiful Finger Lakes region of upstate New York is centered around Cornell University in Ithaca.
Unlike the rest of New York, Tompkins County did not move to the right, with Harris getting 73% of the vote. Harris' best municipality was the city of Ithaca at 87%. Trump's lone victory was Groton, where he got 53%.
Kamala did better in Tompkins County 73% than in The Bronx (72%).
Here’s all the metro areas where Kamala did better than Biden:
Here's a full list of all the metros that swung left in 2024
Only 23 out of the 380+ metros did so, most were pretty marginal but Grand Junction, CO was #1
These are pretty white bread places in general.
Trending blue:
Darien, Connecticut (85% white, 83% college-ed, 232K median income):
2012: R+31 2016: D+12 2020: D+23 2024: D+19
Most of the Tri-State Area (Darien is 43 miles from Times Square) seems to kind of like Trump, but Darien is so classy it finds him appalling.
You might think that after the 2020 summer-long antifa riots in Portland, that it would have wised up, but it looks to have doubled down:
Pretty sure that Portland, OR (#27 in the US at 653K) was the largest city to get more Dem in 2024:
2016: D+65.3 2020: D+70.5 2024: D+71.3
Here’s a town with a lot of physicists:
White Rock, New Mexico (Los Alamos suburb, pop. 6K):
2012: R+9 2016: D+7 2020: D+14 2024: D+22
White + college-educated + high median income: for the most part, Kamala's biggest improvements over Biden and past Dem nominees
Graduate degrees?
How the top counties by grad degree % voted, 2020 → 2024:
Falls Church, VA (48%): D+64 → D+62 Los Alamos, NM (42%): D+27 → D+30 Arlington, VA (41%): D+64 → D+60 Washington, DC (37%): D+87 → D+84
One of the few groups Harris held up relatively well with: rightward swings were pretty small and Los Alamos even swung left.
Here a couple of Denver suburbs:
Columbine, Colorado (Trump-Harris flip):
2012: R+16 2016: R+11 2020: R+2 2024: D+1
Arvada, CO (Denver suburb, pop. 124K):
2012: D+4 2016: D+3 2020: D+15 2024: D+18
Kamala did pretty well in the suburbs:
Elm Grove, WI (92% white Milwaukee suburb):
2012: R+36 2016: R+14 2020: R+3 2024: D+1
Walter White's precinct in Albuquerque, New Mexico:
2012: R+11 2016: D+2 2020: D+5 2024: D+4
Wealthy country club whites:
George W. Bush's precinct in Preston Hollow, Dallas:
2012: R+45 2016: R+13 2020: R+4 2024: R+6
Ted Cruz's home precinct in River Oaks (one of the richest and whitest neighborhoods in Houston):
2012: R+37 2016: R+1 2020: D+4 2024: D+4
Grosse Pointe Farms, Michigan (90% white Detroit suburb):
2012: R+29 2016: R+13 2020: R+0.1 2024: D+0.5
White Ethnics
I’ll put the paywall here before looking at examples of White Ethnics (e.g. Italians, French Canadians), Hispanics, Asians, Blacks, Pacific Islanders, reservation Indians, and Middle Easterners.
As I mentioned in my recent post on Jewish voting patterns, the more establishmentarian Jewish voters are (e.g., the more they are likely to have Episcopalian neighbors, an “In This House We Believe” sign on their nice lawn, and donate to NPR), the more they’ve stayed with the Democrats. The more they listen to their relatives and co-ethnics relative to the mainstream media, the more they like Trump:
Kiryas Joel (Satmar Hasidic Jewish enclave):
Trump 98.5% Harris 1.5%
Back in 2022 (Senate): Schumer 81.3% Pinion 18.2%
People in Kiryas Joel vote the way their rabbi tells them.
In contrast, here’s a Cleveland suburb that’s mostly what I call Old Jews (reform and conservative Ashkenazis) in contrast to the various flavors of New Jews (ultras, Persians, Israelis, etc.) who like Trump quite a bit:
Beachwood, Ohio (majority Jewish suburb of Cleveland):
2012: D+34 2016: D+52 2020: D+49 2024: D+43
Persian Jews?
Beverly Hills, CA (large Persian Jewish population):
2012: D+11 2016: D+31 2020: D+11 2024: R+5
Here’s a more ethnic white Catholic Massachusetts town:
Somerset, MA (pop. 18K, 32% Portuguese/21% French/17% Irish):
2012: D+24 2016: D+3 2020: D+6 2024: R+4 (first R win since 1956)
More Obama-Trump voters in Johnston, Rhode Island (pop. 30K, 36% Italian):
2012: D+16 2016: R+14 2020: R+9 2024: R+19
Staten Island, most Italian county in the country:
On the other hand, Tony Soprano’s upscale suburb liked Romney more than Trump:
North Caldwell, NJ (32% Italian and residence of Tony Soprano) Other demographics: 77% college-ed and median household income of above 200K.
2012: R+24 2016: R+3 2020: D+5 2024: R+2
Similarly, the Providence, Rhode Island metro area, home to Brown U., is traditionally one of the bluer white ethnic places, but Trump made it competitive in 2024:
Providence metro. Covers all of Rhode Island and Bristol County, MA.
Lot of white "ethnic" voters here: Irish, Italian, Portuguese, etc.
2012: D+25 2016: D+13 2020: D+18 2024: D+9
The giant New York Metro area is pretty similar to Providence:
New York, NY-NJ-PA Metro Area (pop. >20M, #1 in the US):
2012: D+32 2016: D+29 2020: D+28 2024: D+14
What about Armenians?
There were a few Republican precincts in Glendale, CA (most Armenian place in the country at 40%):
2012: D+32 2016: D+31 2020: D+20 2024: D+12
French Canadians?
French Canadians are among the more downscale white ethnics, so northern Canucks used to vote staunchly Democratic. But not anymore:
Eight Northern Maine-Canada border towns (51% French/French Canadian): Towns: Fort Kent, Frenchville, Grand Isle, Hamlin, Madawaska, St. Francis, St. John, and Van Buren.
2012: D+42 2016: D+6 2020: R+0.1 2024: R+12
Middle East & North African
How about an Arab and Muslim concentration that goes back to Henry Ford recruiting workers from the Levant?
Will Republican gains in Dearborn, MI (pop. 110K, ~45% Arab) last long-term?
As I’ve mentioned before, the Puerto Rican swing to the center is not something I expected 20 years ago:
Holyoke, MA Ward 2B (83% Hispanic, mostly from PR):
2012: D+86 2016: D+77 2020: D+44 2024: D+21
Cubans?
Hialeah, Florida (~75% Cuban)
2012: R+9 2016: R+0.1 2020: R+34 2024: R+53
Venezuelans?
Doral, FL (most Venezuelan place in the US at 33%)
2012: D+17 2016: D+42 2020: D+4 2024: R+23
New Mexico is kind of the West Virginia of blue states, but its Hispanics, at least the Mexican kind as opposed to the ancient settlers, are also trending toward Trump:
Sunland Park, NM (93% Hispanic city across from El Paso and Juarez):
2012: D+62 2016: D+56 2020: D+39 2024: D+14
Dems are making gains with white NM voters, especially in the Albuquerque area. However, similar swing among NM Hispanics compared to the rest of the country.
What about the Hispanics who have been in Colorado for hundreds of years since Spanish rule?
Hispanic shift is evident among Spanish descendants as well.
Costilla County, CO (57% Latino, pop. of 3.5K)
2012: D+59 2016: D+29 2020: D+27 2024: D+15
More Hispanic shifts:
2016 → 2024 results in Harris County's [Houston] most Hispanic places:
South Houston (91%): D+43 → R+2 Galena Park (91%): D+47 → D+2 Aldine (88%): D+38 → D+2 Jacinto City (87%): D+41 → R+5
Swings not as drastic but still significant in Chicagoland's Hispanic areas from 2020 to 2024:
In the highly Indian suburb of Edison, NJ, in one district a colossal swing toward Trump (the town went for Kamala overall):
Edison, NJ Voting District 78 (95% Asian, mostly Indian): Other demographics: 61% college-ed, more than 50% have a household income above 100K. This area's Indians are largely Gujarati, religion-wise mostly Hindu
2012: D+80 2016: D+66 2020: D+64 2024: R+30
Big swing in this 89% Asian (mostly Chinese) precinct in Flushing, Queens:
2016: D+41 2020: D+21 2024: R+8
Westminster, CA (~45% Vietnamese, pop. 91K):
2012: D+2 2016: D+15 2020: R+9 2024: R+9
All in all, Kamala trended well among Nice White People, the type who put In This House We Believe signs on their nice front lawns. Trump trended well among not so nice and/or not so white people.
Those northern Maine French Canadian towns you listed are all Acadian French, not Quebecois. Unlike most French Canadians in the US, they didn't come down from Quebec to work in the mills in the late 19th-early 20th centuries. The Acadians have been there in the St. John Valley since the British expelled them from Nova Scotia in the mid-18th century. (See Longfellow's Evangeline for details.) That area didn't even become part of the US until 1842. I have no idea how that history affects their votes in 2024, but I'd be careful about assuming that they're similar to the other, much more numerous French Canadians who settled in the cities and mill towns of New England. Because they settled in more populated places over a century ago, it's probably a lot harder to find precincts with large concentrations of them.
The last graph describes my neighborhood. White, upper middle class, used to be GOP territory but now Dem city councilor, state rep, state senator, and congressman although the CD includes the central city. Multiple “in this house” yard signs visible on my normal route for walking the dog, Kamala yard signs probably 4:1 versus Trump. Thankfully I live in a red state, which makes it easier to live in a blue city. I would say a lot of the GOP holdouts are Catholic.